
Big brother is watching: Why extensive monitoring is so important
Why is it important to monitor your systems?
A failure of productive systems that is not responded to in a timely manner can lead to economic damage in addition to unreliable accessibility of a service.
That's why it's important to use monitoring systems that can predict when problems might occur and perform retrospective analysis to do so. In addition, they should offer the function of comparing different data or metrics from different sources.
In order to guarantee our customers reliable accessibility of their websites and services and to be able to react to possible disruptions in good time, we rely on so-called whitebox and blackbox monitoring.
Which forms of monitoring do we use and why?
Blackbox monitoring
Here we speak of blackbox, because monitoring looks at results that are detected outside the application. In other words, how a user would see the application from the outside. Blackbox monitoring basically shows us that a service is not working at the moment, i.e. the symptoms of a service.
Whitebox monitoring
Here, the application itself provides information about the current status of its interior. The application can output much more extensive internal statistics; this makes it possible, for example, to find more precise reasons for the symptoms detected by blackbox monitoring.
An example of the interaction between blackbox and whitebox monitoring:
Blackbox monitoring reports that access to a website is very slow. A quick look at the whitebox monitoring shows that the system's network card has an increased number of faulty packages. This suggests that the transmission medium is possibly defective.
Proactive action vs. reactive action
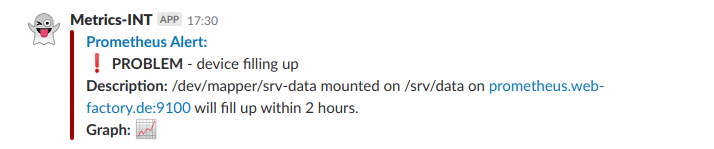
A correctly set up monitoring infrastructure must also offer the function that it notifies proactively and not only when a service is unavailable. Because by then it is usually already too late.
Distributed monitoring
In order to obtain reliable results about the reachability of services, it is essential to check them from different geographically distributed locations.
On the one hand, this can reduce unnecessary false alarms and, on the other hand, we have, for example, metrics about the loading time of a website from different locations and networks.
Technical Infrastructure
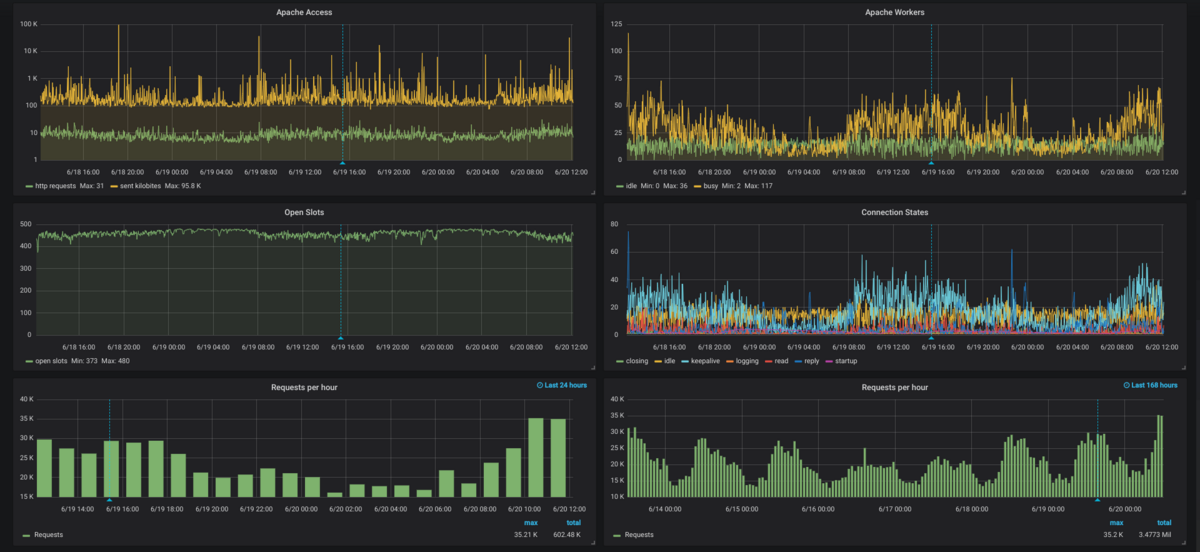
To monitor systems and services, we use open source products such as Prometheus or Icinga2. In doing so, we use Grafana to visualize the data.
If you need help evaluating or implementing a new monitoring infrastructure, we are here to help. Just leave us a message in the contact form and we will get back to you shortly!
Please feel free to share this article.
Comments
No comments yet.